Learn more about Thinkorswim (by TD Ameritrade) Charting
Introduction to Thinkorswim Charting
If you’ve been dabbling in trading for a bit, you’ve probably stumbled upon Thinkorswim by TD Ameritrade. This platform packs quite the punch for those interested in dissecting market data through detailed charting. While it might not make your coffee in the morning, it does provide a variety of technical analysis tools that can make evaluating stocks a whole lot more manageable.
Getting Started with Thinkorswim
Getting your bearings with Thinkorswim isn’t going to be the same as a casual Sunday drive. But don’t fret; with the right approach, you’ll soon have it mastered. After you’ve logged in, you’ll find that the platform is divided into several tabs: Monitor, Trade, Analyze, Scan, Marketwatch, Tools, and Help. The Charts tab, however, is where the magic happens, giving you access to a wide array of chart types and technical indicators.
The Basics of Charting
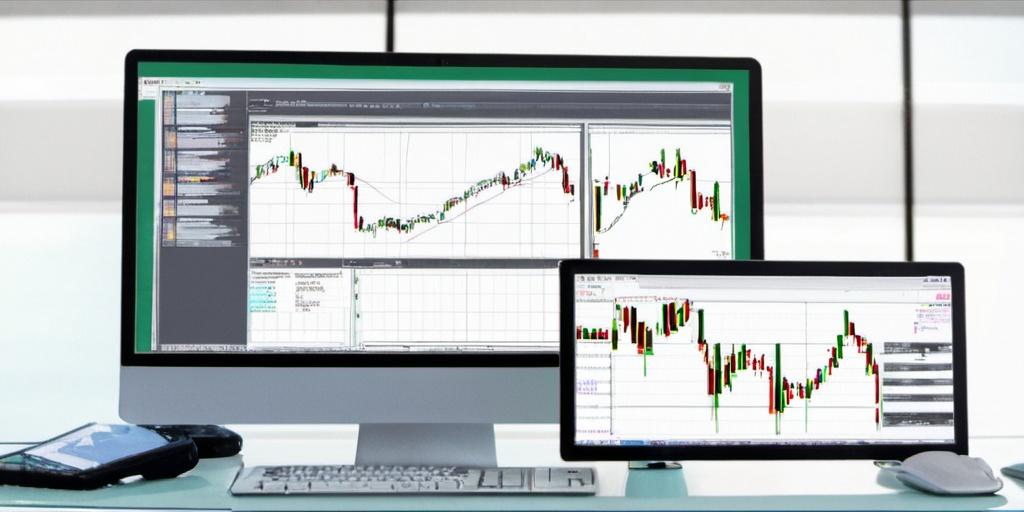
Charts in Thinkorswim aren’t just static pictures; they’re living tools that can help you predict market movements. You can choose from standard bar charts, candlestick charts, or line charts, depending on what tickles your fancy. Candlesticks tend to be popular among traders for their comprehensive visual representation of price movements.
Once you’re set on a type, you can poke around in the Studies section. Thinkorswim offers a buffet of technical indicators such as moving averages, RSI, MACD, and Bollinger Bands. How you combine these with your chart style can be as unique as your fingerprint, helping you hone in on signals that matter most to your personal trading strategy.
Customizing Your Charts
Customization is where Thinkorswim really earns its stripes. Not only can you set specific timeframes and styles, but you can also create custom scripts to carry out functions unique to your trading strategy. Once you’ve defined your chart settings to your liking, you can save them for future use. That way, you don’t have to reinvent the wheel every time you log in.
Perhaps you like your candlesticks to be a particular color, or maybe you prefer the gridlines to be a little less in-your-face. Whatever your preference, Thinkorswim allows you to tweak these details, giving you a workspace that’s as unique as your favorite coffee order at that overpriced cafe you frequent.
- Chart Style: Select from bar, candlestick, or line charts.
- Studies: Use built-in technical indicators or script your own.
- Appearance: Customize colors and gridlines to your liking.
Advanced Features
For those who eat, sleep, and breathe data, Thinkorswim offers advanced chart features like pattern recognition and strategy roller. These tools allow users to identify established patterns such as head and shoulders, triangles, and much more. The strategy roller lets traders automate their covered call options strategies, rolling them from one expiration cycle to another based on predefined criteria. It’s like setting cruise control for your portfolio.
Real-World Application
Imagine you’re eyeing a stock that’s been on a roller coaster of highs and lows. By employing Thinkorswim’s charting capabilities, you can apply a moving average to determine long-term trends while simultaneously setting alerts for price points you deem significant. The platform also allows you to conjoin multiple indicators, like combining RSI with MACD, to ensure your trading decisions have a well-rounded foundation.
Traders often share anecdotes about how a particular chart setup alerted them to a lucrative opportunity or saved them from a financial nosedive. One trader, for instance, used the parabolic SAR indicator in Thinkorswim to identify an upward shift in a languishing stock, ultimately resulting in a gain that blew his expectations out of the water.
Integration with Other Features
Thinkorswim doesn’t operate in a vacuum. Its functionalities can be integrated with other platform features, such as the Analyze tab, to simulate trades and visualize potential market outcomes. You can also sync it with your mobile app, making sure you’re not out of the loop while grabbing your mid-day coffee.
Furthermore, the Thinkorswim Learning Center offers tutorials and resources to help you take full advantage of its charting capabilities.
Conclusion
Thinkorswim charting provides a robust toolkit for those looking to crunch numbers and spot trends in the market. Whether you’re a seasoned trader or just getting your feet wet, the platform offers something for everyone. From customizable charts to advanced pattern recognition, it’s a trading aficionado’s playground. While it may not replace intuition and experience, it gives you the data necessary to make informed decisions. That’s the bottom line for any trader worth their salt.