Learn more about Charting Software
Charting Software in Trading
So you’re cruising along on your trading journey, and you hit this juncture where the line, candlestick, or OHLC bar stops speaking your language. That’s when you realize you need some charting software. It’s like a translator for the wild world of finance, turning those mystical symbols into something you can actually make sense of. Let’s talk about why this stuff matters and how to pick out the right fit for your trading escapades.
The Basics of Charting Software
Charting software lays out the financial landscape, displaying stock prices over time and letting you eyeball trends, patterns, and potential breakouts. It’s your GPS in the world of trading, pointing you toward opportunities and avoiding those pesky detours.
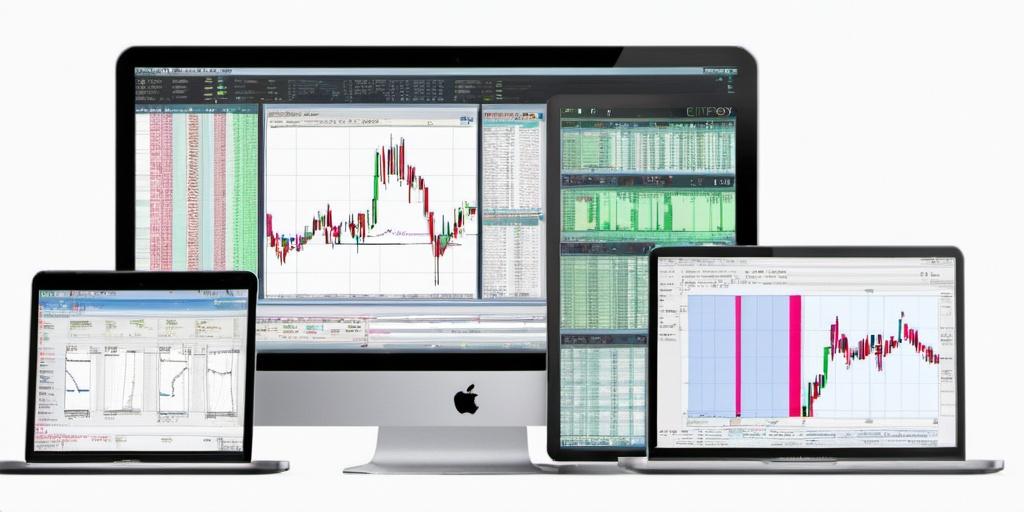
The good software will show real-time data and historical charts. You got your line charts for a straightforward view, the candlesticks when you want to get fancy, and OHLC bars for the whole enchilada of open, high, low, and close prices. They paint the bigger picture for ya.
Getting Real: Importance of Charting Software
Imagine trying to drive a car blindfolded. Scary, right? Trading without charting software is just like that – terrifyingly uncertain. By breaking down the data, charting software turns chaos into clarity.
Good ones offer indicators galore – moving averages, MACD, RSI, you name it. They help in predicting those market movements. They won’t make you the next Warren Buffett overnight, but they’ll certainly do better than your grandpa’s Ouija board.
What to Look For
Alright, so you’re ready to cash in on the benefits of charting software. What should you be looking for? Well, lots of things. Here’s a little peek:
- User-friendly Interface: If you need a PhD to operate it, steer clear.
- Customization Options: The ability to tweak those charts to your trading style is a must.
- Real-time Data: Because stale data is as useful as a chocolate teapot.
- Variety of Indicators: To get the full Monty of market insights.
- Compatibility: Make sure it plays nice with your existing setup.
Popular Charting Software
Not all charting software is cut from the same cloth. Some are like the Swiss army knives of the trading world, while others might feel a bit more like a butter knife. Here’s a quick look at some of the heavy hitters.
TradingView: It’s like the social network of trading platforms. With its cloud-based setup, you can trade from anywhere, and it’s packed with indicators.
MetaTrader: Primarily known for forex, it’s a fan favorite for seasoned traders. You can fire up your own custom indicators if you’re feeling ambitious.
NinjaTrader: While not the ninja you might hire for covert ops, it does offer advanced charting with a focus on precision. It’s suited for those who like to keep fine-tuning their strategies.
Thinkorswim: Brought to you by TD Ameritrade, this one’s known for its robust educational resources. Great for learners eager to sharpen their skills.
Tales from the Trading Desk
Let me regale you with a tale from my trading days. Once upon a time, armed with nothing but my gut instinct, I watched a stock plummet faster than a lead balloon. Panic ensued. Enter charting software, with its holistic view of the market. No more blind leaps or gut-driven trades. My decisions became calculated, precise, and most importantly, profitable.
Final Thoughts
In the wild west of trading, charting software is your trusty steed. Sure, it won’t win the race for you, but it’ll make sure you’re heading in the right direction. Whether you’re a rookie or a seasoned pro, investing time in learning to leverage good charting software can be the difference between a profitable trade and a facepalm moment. Keep those graphs handy, and may your trades be ever lucrative.