Learn more about YCharts Analytics

Understanding YCharts Analytics
In the world of finance, the ability to make informed decisions quickly is always the name of the game. One platform helping with just that is YCharts Analytics. It’s a comprehensive tool for investors who want a clear view of what’s happening in the markets. Unlike the tools that drown you in data, YCharts aims to present information clearly and concisely, making it easier to decide what to do with your investments.
Features and Capabilities
YCharts comes packed with tools to analyze stocks, mutual funds, and ETFs. Among its strengths is the stock screener that allows users to filter stocks based on a slew of criteria. Whether you’re interested in a specific sector or want to find dividends offering the best returns, YCharts can handle it.
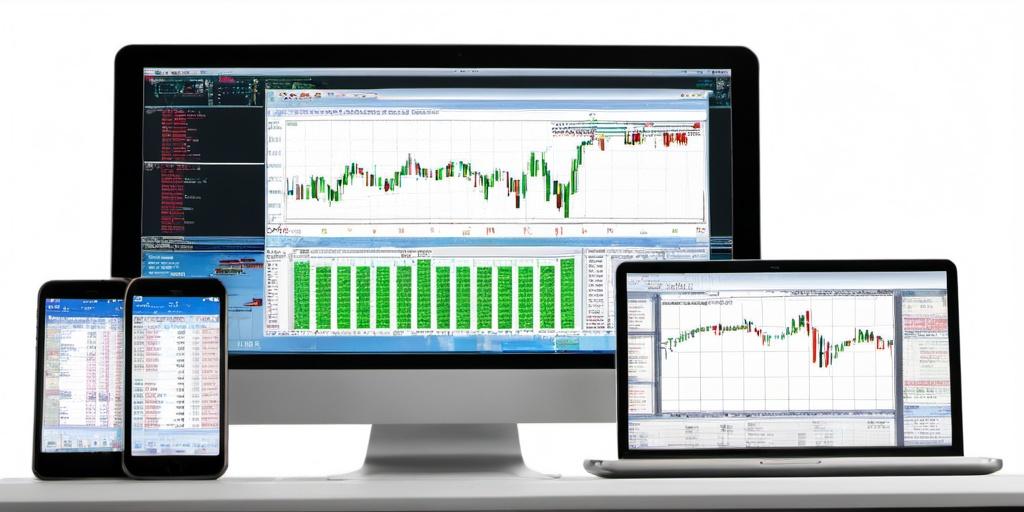
Data visualization is another area where YCharts shines. Its easy-to-use charting tools let you visualize any data series you’re analyzing. Whether you’re looking at historical price performance or fundamental analysis, the charts are neat and customizable.
Custom Reports
If spitting out reports is your thing, YCharts lets you do that with a few clicks. With customizable templates, you can whip up professional-looking reports faster than you can say “spreadsheet”.
Investment Ideas
YCharts is also about inspiration. It delivers fresh investment ideas by tracking trends and offering model portfolios. A little like having a financial advisor whispering fresh ideas in your ear—minus the hefty fees.
Use Cases
Imagine you’re a portfolio manager needing to evaluate dividend-paying stocks within the tech industry. You fire up the YCharts stock screener, set your filters, and voila—a refined list of potential investments. You further analyze these stocks using the platform’s comprehensive financial data, coupled with visual charts that provide insights like never before.
For financial advisors looking to provide value to clients, the platform’s ability to create tailored reports can be incredibly useful. It enhances transparency and builds trust with clients, showing them exactly how their investments are performing.
Comparing with Competitors
YCharts has plenty of rivals, but what sets it apart is its user-friendly interface and the broad range of data it provides. Competitors like Bloomberg Terminal might offer more data but at a cost that often isn’t justifiable for smaller investment firms or individual investors. The price point of YCharts is often more palatable for these users.
Pricing and Accessibility
Speaking of costs, YCharts offers a clear pricing structure with several tiers, each providing different levels of access. While it’s not cheap, it’s also not out of reach for most serious investors or small firms. For those investing on their own, the platform’s ease of use might just make the price tag worth it.
Conclusion
For investors who need clarity and precision in their data without feeling overwhelmed, YCharts Analytics is a solid choice. Its combination of tools, ease of use, and flexibility in generating insights makes it a useful companion for both professional and individual investors. Whether you’re sifting through stocks, managing client reports, or seeking market trends, YCharts provides a robust platform to meet those needs.