Learn more about Bloomberg Terminal Charting App
The Bloomberg Terminal Charting App: A Closer Look
In the bustling finance world, professionals lean on tools to make decisions that could send their careers into the stratosphere or crashing down. One heavy-hitter in the finance sector is the Bloomberg Terminal. Known for more than a few things, Bloomberg’s charting app is a core component. Let’s roll up our sleeves and dig into what makes this app tick.
Bloomberg Terminal Basics
Before diving into charts, here’s a quick refresher on Bloomberg Terminal’s primary functions. Imagine it as the Swiss Army knife of financial tools, offering real-time data, analytics, news, and of course, charting capabilities. It’s designed for traders, analysts, and anyone hungry for data.
Charting Capabilities: What’s the Deal?
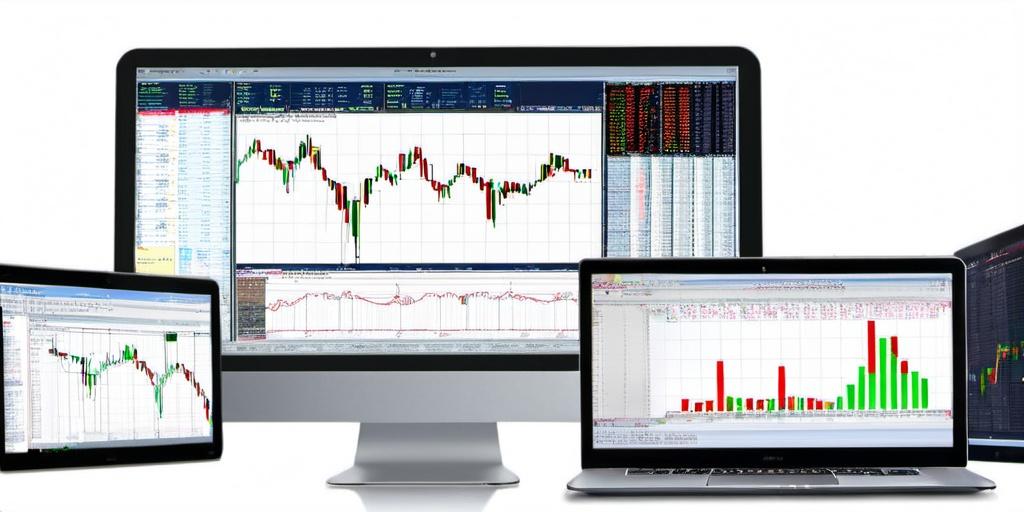
The charting app in Bloomberg Terminal is where data transforms into visual stories. It allows users to create and customize charts, helping to make sense of complex data patterns. This ain’t your grandma’s pie chart tool. Users can analyze various assets, from stocks to commodities, with precision.
Why’s that important? Well, imagine trying to spot trends or abnormalities from rows and columns of numbers. A nightmare, right? Charts whisk us away from those dizzying digits, offering clarity and insight.
Starting With the Basics: Trend Analysis
Trend analysis is where it all begins. The charting app offers several chart types, like line, bar, and candlestick, each with its quirks. Remember the Cinderella story where the slipper fits perfectly? That’s how a well-suited chart feels.
Trend lines, a hallmark feature, allow users to identify where the market’s headed. They draw connections between price points on a chart, making trends visible and hopefully, leaving traders in the black.
Technical Indicators Galore
The app isn’t shy about its technical indicators. With over 100 to choose from, traders can apply moving averages, Bollinger Bands, and even Fibonacci retracements. Whether you’re a fan of stochastics or RSI, there’s something here for everyone.
It’s like a buffet of data-driven delights. Picking the right indicator is like choosing between chocolate and vanilla – it depends on your palate, or in this case, your strategy.
Customization and Flexibility
Customization is where the Bloomberg charting tool stands head and shoulders above many. Users can tailor charts to match their needs, whether it’s changing the timeframe or adjusting the color scheme.
Ever get tired of looking at the same old gray screens? A splash of color or a tweak in layout can breathe fresh life into your analysis, making work feel less like, well, work.
Real-Life Use Case: The Curious Case of the Trending Stock
Take, for example, a trader following a tech company’s stock. The charting app allows them to overlay indicators, highlight key price levels, and spot any emerging trends. It’s here where the magic unfolds, connecting dots between price movements and market news.
Integration: Bridging News and Data
The Bloomberg Terminal doesn’t just deliver raw data. It integrates news with charting, providing context. Seeing a stock’s sudden surge? Maybe there’s a news headline you missed. With Bloomberg, a quick news check is just a click away, providing that ‘Aha!’ moment.
The Need for Speed
In trading, delays are costly. Bloomberg understands this, offering real-time updates that are crucial for decision-making. When the market’s moving and you’re grasping at straws, those precious seconds could mean the difference between a mansion and a cardboard box.
Learning Curve: Scaling the Wall
While powerful, Bloomberg’s charting app isn’t the most intuitive for beginners. Think of it as learning to drive a stick shift. But once you master it, you’ll wonder how you ever managed without it. Thankfully, Bloomberg offers tutorials and support, so you’re not thrown to the wolves.
Conclusion
Bloomberg’s Terminal charting app stands out with its mix of reliability, depth, and flexibility. It gives traders an edge with its range of tools and integration of news, making it a staple for finance professionals. Sure, it might seem daunting at first, but isn’t that true for anything worth its salt?