Learn more about Finviz Charting
Understanding Finviz Charting
So, you want to get a handle on Finviz charting? It ain’t no rocket science, but it’s also not your Uncle Bob’s Sunday crossword. Trading platforms like Finviz provide tools that make the stock market more digestible. You can get charts that aren’t just eye candy but data-loaded with intel. After all, pretty colors don’t pay the bills.
Why Finviz? Because It’s Like a Smart Friend
The market can be a wild west, and you need a trusty sidekick. Finviz is like that pal who’s a tad nerdy but knows their stuff. It’s got a user-friendly interface, which is refreshing if you’ve ever wrestled with complex trading software that requires a Ph.D. in finance to use.
How to Get Started with Finviz Charts
Before you dive head-first into the treasure trove of charts, you gotta know the basics. Start by visiting their website. No need for a golden key or secret handshake, just a simple login. You’ll see a bunch of tabs like “Groups,” “Portfolio,” and “Maps.” Focus on “Charts”—that’s where the magic happens.
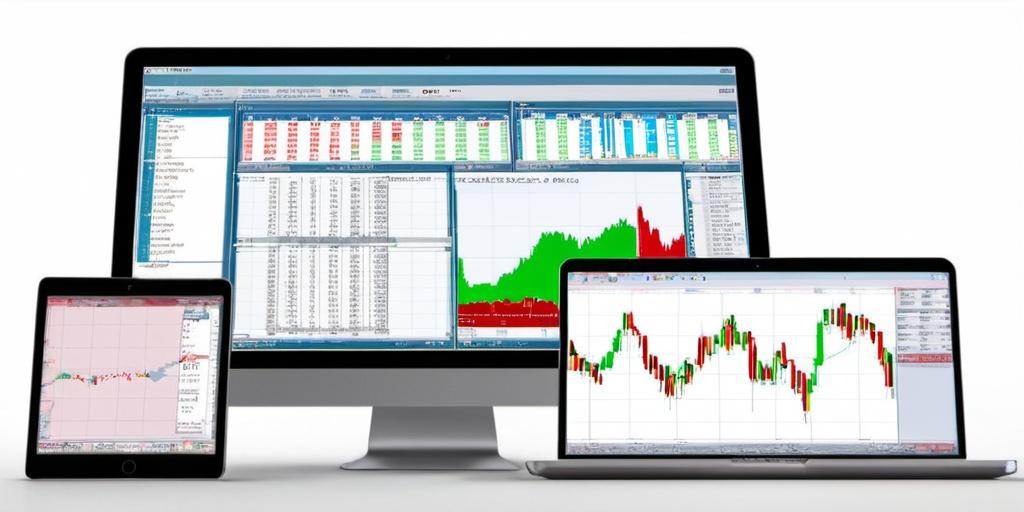
The Essential Features of Finviz Charts
Finviz has several features that traders just love.
- Interactive Charts: These are clickable and zoomable, allowing you to see the finer details of those market nuances.
- Technical Indicators: Just like the tools in a Swiss Army knife, you’ve got moving averages, RSI, MACD—the usual suspects.
- Performance Tabs: Compare stocks side-by-side, possibly better than your kids fighting over who’s taller.
Customization: Make It Yours, Just Don’t Break It
Finviz lets you customize what you see and how you see it. Wanna change colors? Go ahead. Need to adjust time frames? Easy as pie. Of course, customization doesn’t mean going overboard. Keep it practical, or you might end up hip-deep in settings you don’t need.
Analyzing Stock Patterns Like a Pro
Now, let’s talk technical analysis. The bread and butter of any Finviz enthusiast. Whether you’re scoping out head and shoulders, triangles, or Fibonacci retracements, Finviz has got the patterns covered. It’s all about finding patterns in the static, like hearing a distant melody through the noise.
Handling Volatility with Finviz
If you’ve ever been on a rollercoaster, you’ll get volatility. This is where Finviz can be a lifesaver. Use those charts to determine when to dive in or when to hightail it out of a stock. Remember, life’s not about timing the market but time in the market. Unless, of course, it’s a market free-fall.
The Free vs. Elite Version: Worth the Jump?
Yes, there’s a paid version known as Finviz Elite. If you’re serious about trading, the Elite version offers real-time data, advanced charts, and backtesting. It’s like having premium channels—you might wonder how you ever lived without it.
A Few Cautionary Words
Even with all the bells and whistles, Finviz is a tool, not a crystal ball. Over-reliance can lead to misplaced confidence. Use it to inform, not dictate, your decisions. In the wild plains of the market, the chart is your map, not your GPS.
Final Thoughts
Finviz charting is an excellent ally in the stock trading game, providing insights while you sip your morning coffee. Will it make you a Wall Street mogul overnight? Probably not. But with consistent effort, informed decisions, and a smidge of that old-fashioned luck, it could help you become a savvy trader. Finviz might be the friend you never knew you needed, in the stock market, at least.